|
Houghton Safe Routes to School
|

|

|
Safe Routes to School (SRTS) is a federal program within the U.S Department of Transportation, with the goal of creating communities where both children and parents feel safe using active transportation and are encouraged to travel actively to and from school. In Michigan, the Michigan Fitness Foundation administers the SRTS grant program with major initiative funding of up to $200,000 per school for infrastructure $8,000 per school for active travel educational programming.
These maps and associated report represents the background research done in order to better inform Houghton Elementary and Middle schools in their pursuit of funding. The goal of this grant is to significantly increase the number of children utilizing active transport as well as the safety of those children in their commutes to and from school. This work was completed by MTU Social Science students under the direction of Dr. Don Lafreniere and Dr. Richelle Winkler.
These maps and associated report represents the background research done in order to better inform Houghton Elementary and Middle schools in their pursuit of funding. The goal of this grant is to significantly increase the number of children utilizing active transport as well as the safety of those children in their commutes to and from school. This work was completed by MTU Social Science students under the direction of Dr. Don Lafreniere and Dr. Richelle Winkler.

|

|

|
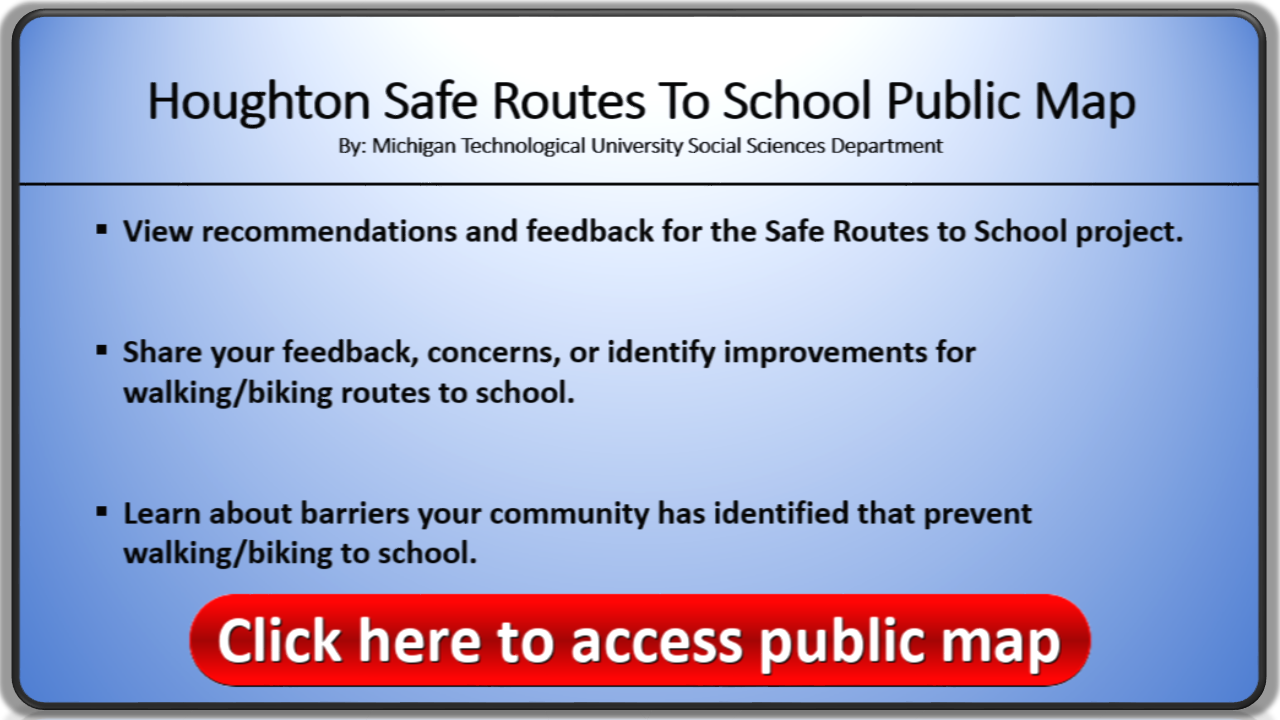
Click image to access the public map.
See below for instructions.
|
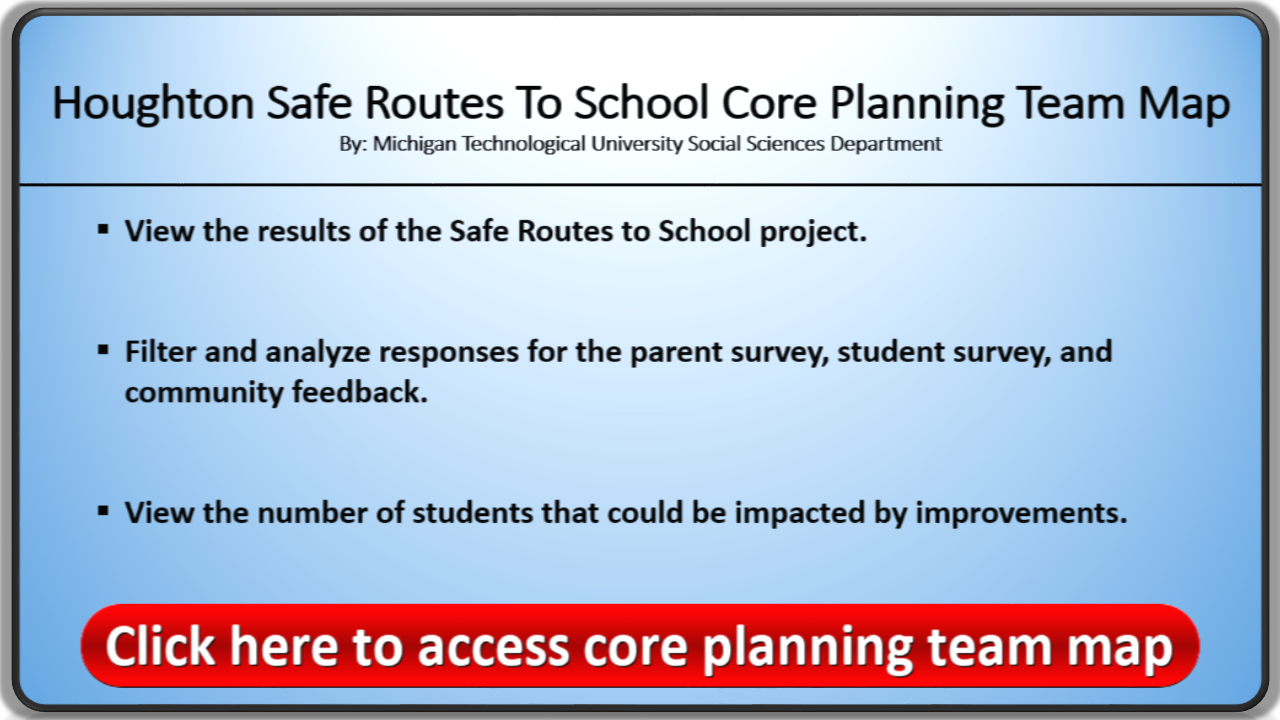
Click image to access core planning team map.
See below for instructions.
This map requires a password and login, please contact Dr. Don Lafreniere at djlafren@mtu.edu to request access.
|
Houghton Safe Routes to School Web Map Instructions
Public Web Map
The public web map permits viewing of many of the datasets compiled during the project as well as community feedback, and recommendations outlined in the Houghton Safe Routes to School Report. The map includes an interactive tool for community members to submit their own information about safe or unsafe areas in our community.
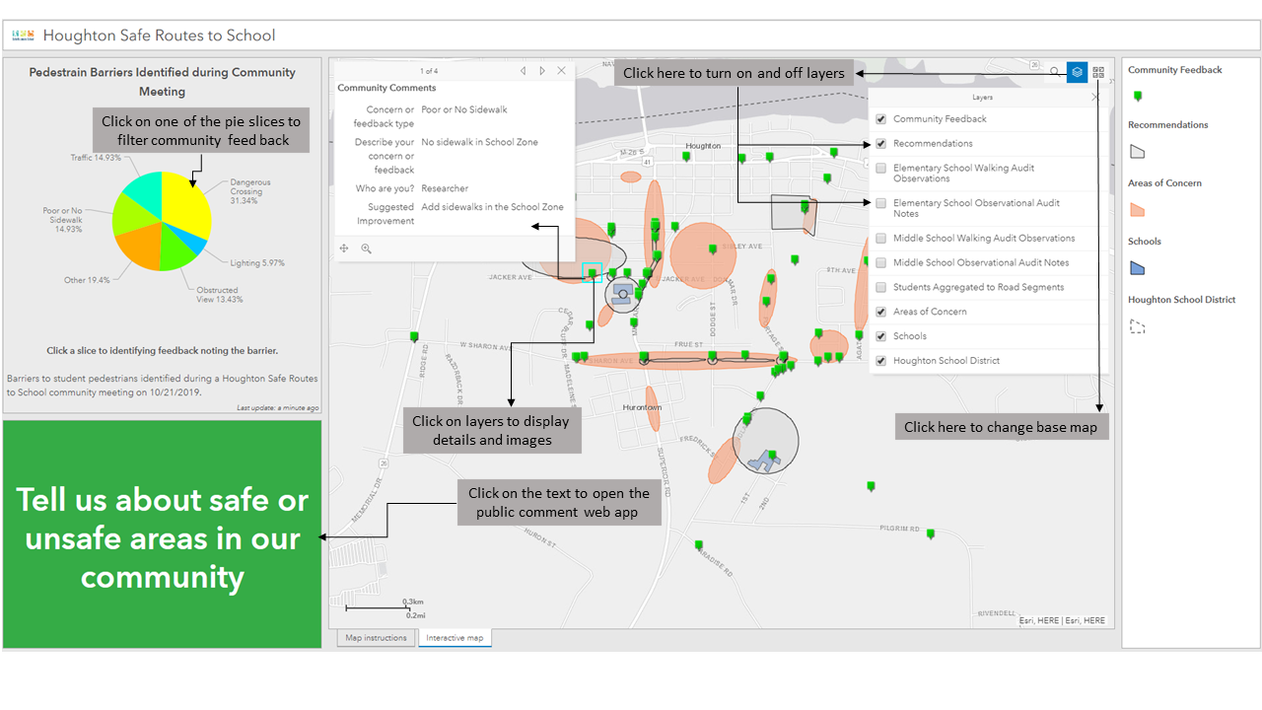
- Turn on and off data layers
- Click on the layers symbol in the top right-hand corner of the screen.
- A drop down will appear with checkboxes next to the names of the layers, click on the checkboxes to turn on and off a layer.
- Change background maps
- Click on the map symbol in the right-hand corner of the screen.
- A drop down will appear with different background maps to choose from, click on one to change the background map.
- Examine details of data
- Click any of the symbols on the map.
- This will bring up a pop up with detailed information about the data.
- Filter community feedback by type of response
- On the right side of the screen click on one of the slices of the pie chart. Feedback for the selected pie ‘slices’ only will be visible on the map.
- Select more than one slice of the pie chart to show a combination of barriers (note this tool is dynamic meaning that as you zoom in and out the pie chart will change accordingly).
- Submit feedback
- Click on the green and white “Tell us about safe or unsafe areas in our community” button in the lower left-hand side.
- This will take you the feedback portal, click the proceed as guest icon to proceed.
- The submission system shares many of the same functions as the public viewer web map. To submit feedback click the green and white “Submit Feedback” button in the lower right-hand side.
- Click a location on the map and fill in the boxes with the appropriate information.
- Click ‘Report’ to submit.

Core Planning Team Web Map
The core planning team webmap shares many of the same functionalities as the public viewer web map but contains all of our research data. Additionally, the policymaker web map includes a “number of students” counter at the bottom left hand corner and more dynamic pie charts to filter data. This tool is dynamic and affords a quick view of how many students live within the area viewable on the map. A login is required for this web map. Contact Dr. Don Lafreniere (djlafren@mtu.edu) for access.
The core planning team webmap shares many of the same functionalities as the public viewer web map but contains all of our research data. Additionally, the policymaker web map includes a “number of students” counter at the bottom left hand corner and more dynamic pie charts to filter data. This tool is dynamic and affords a quick view of how many students live within the area viewable on the map. A login is required for this web map. Contact Dr. Don Lafreniere (djlafren@mtu.edu) for access.
- Turn on and off data layers
- Click on the layers symbol in the top right-hand corner of the screen.
- A drop down will appear with checkboxes next to the names of the layers, click on the checkboxes to turn on and off a layer.
- Change background maps
- Click on the map symbol in the right-hand corner of the screen.
- A drop down will appear with different background maps to choose from, click on one to change the background map.
- Examine details of data
- Click any of the symbols on the map.
- This will bring up a pop up with detailed information about the data.
- Filter community feedback and survey results by type of response
- On the right side of the screen click on one of the slices of the pie chart. Feedback for the selected pie ‘slices’ only will be visible on the map.
- Select more than one slice of the pie chart to show a combination of barriers (note this tool is dynamic meaning that as you zoom in and out the pie chart will change accordingly).
- On the bottom of the pie chart pane click the arrows to switch between pie charts.
- Switch between schools for student count
- The student counter is located on the bottom left hand side. The counter shows the number of students currently in the view of the map (this tool is dynamic meaning that as you zoom in and out the numbers change accordingly).
- To switch between schools click on the arrows at the bottom of the box. This will switch the student count between the middle and elementary schools.